
BII toolkit learning
Understand, then apply
Explore climate concepts through the original toolkit diagrams and clearly labeled worked examples.
Module 20
Read portfolio results with their context
Guidance eighteen shows example dashboards linking detailed climate data to enterprise decisions. All figures in this source artwork are examples, not live portfolio results. Includes a clearly labeled fictional teaching scenario.
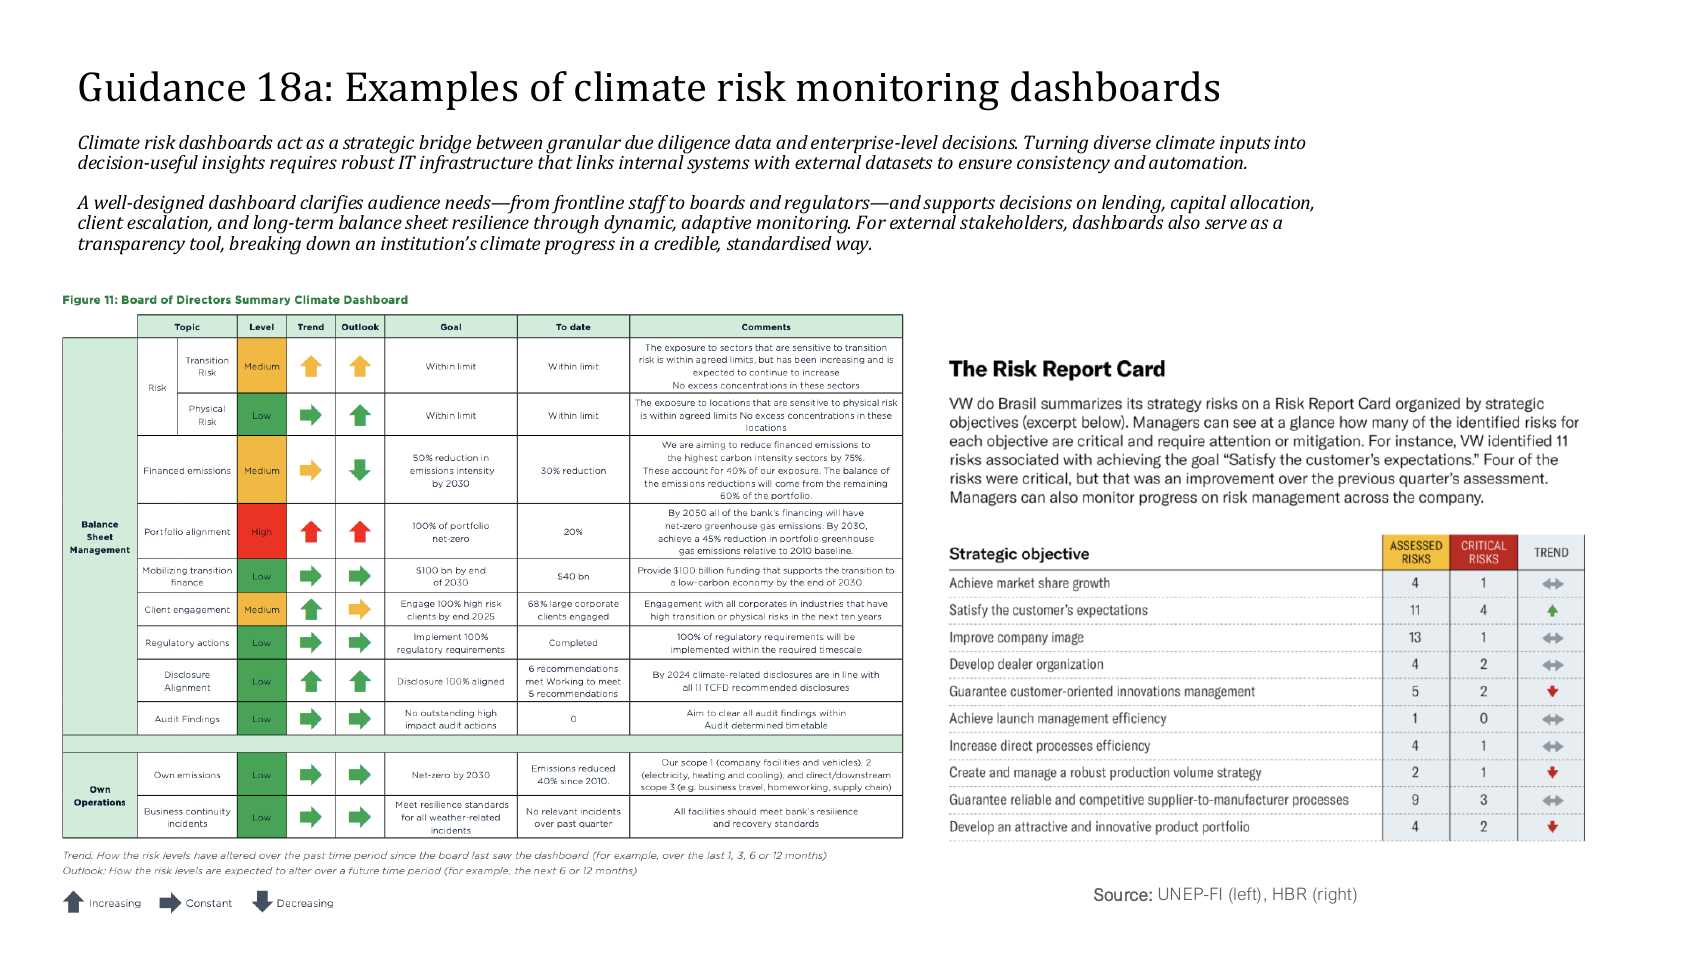
The fictional portfolio, including CoastalFoods, uses invented counts. Guidance 18 dashboard figures are original source examples, not live results.
Transcript and key points
- Invented portfolio containing CoastalFoods; assessed clients only.
- Fictional review: the ratio falls after new clients are assessed.
- Source examples support interpretation, not lending approval.
Loading transcript...
Open complete transcriptBII; original examples credited to UNEP-FI and HBR. BII; original examples credited to UNEP-FI. Original source artwork is preserved; motion only reframes existing content. Narration and original piano accompaniment generated locally.
All original sources for this lesson
- BII Guidance 18a: original example dashboards
BII; original examples credited to UNEP-FI and HBR
Open original diagram - BII Guidance 18b: original example dashboards
BII; original examples credited to UNEP-FI
Open original diagram